Point cloud at each pole

Everything the detector decides rests on a handful of returns. This is what it saw. A candidate is a compact vertical cluster standing clear of the canopy, at the same setback from the road as its neighbours. A tree is a broad blob. “Compact” is looser than it sounds: the test is a 3 m footprint, so the returns typically spread about 1–2 m, not the 0.25 m of an actual pole. In the elevation and section panels the colour is the distance that panel flattens away, so white points are level with the pole and coloured ones are not.
line
plan: colour = height, 0–20 m elevation & section: colour = the distance that panel flattens away. white = level with the pole, red/blue = away from it. Each has its own scale bar green: the returns that make up this pole's column height band, above ground: the only heights searched (both panels) offset window, around the line's common offset (section only) the line's common offset detected pole position road centreline (plan panel) window around each pole
What the three cloud panels are, and why two of them look different

The aircraft flew over once with a downward laser. Every return is one x, y, z point. There is only one cloud; the panels are three ways of flattening it, and the direction you look is always perpendicular to the axis you keep.

Offset is the one word to get straight. It is how far the pole stands from the middle of the road, measured straight out sideways. A pole at −8.7 m is 8.7 m from the centreline, and the minus sign only says which side. A utility crew sets poles at a consistent setback down a street, so every pole on one line shares roughly that number, which is exactly the regularity the detector tests for.
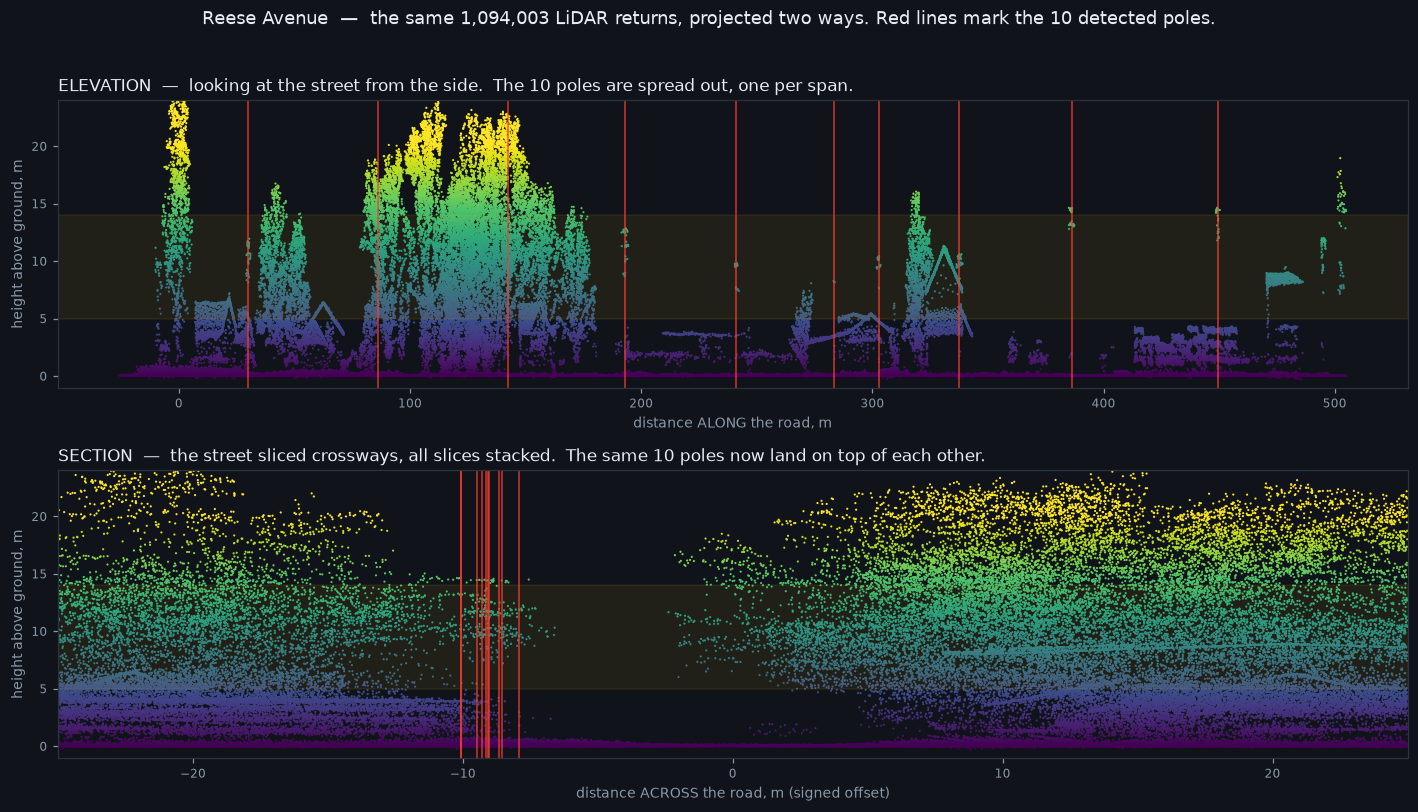
Reese Avenue, 1.09 million LiDAR returns plotted as an elevation along the whole street and as a section across it
A whole street at once: all 1,094,003 returns along 500 m of Reese Avenue. This is where poles look like poles. In the elevation each one is a thin stripe standing clear of the canopy, one per span. In the section below, the same ten stack into a single band because they share a setback. One pole's chip cannot show you this — it holds 7,000 returns and one pole, so there is nothing to compare against. The pattern is the evidence, not any single column.
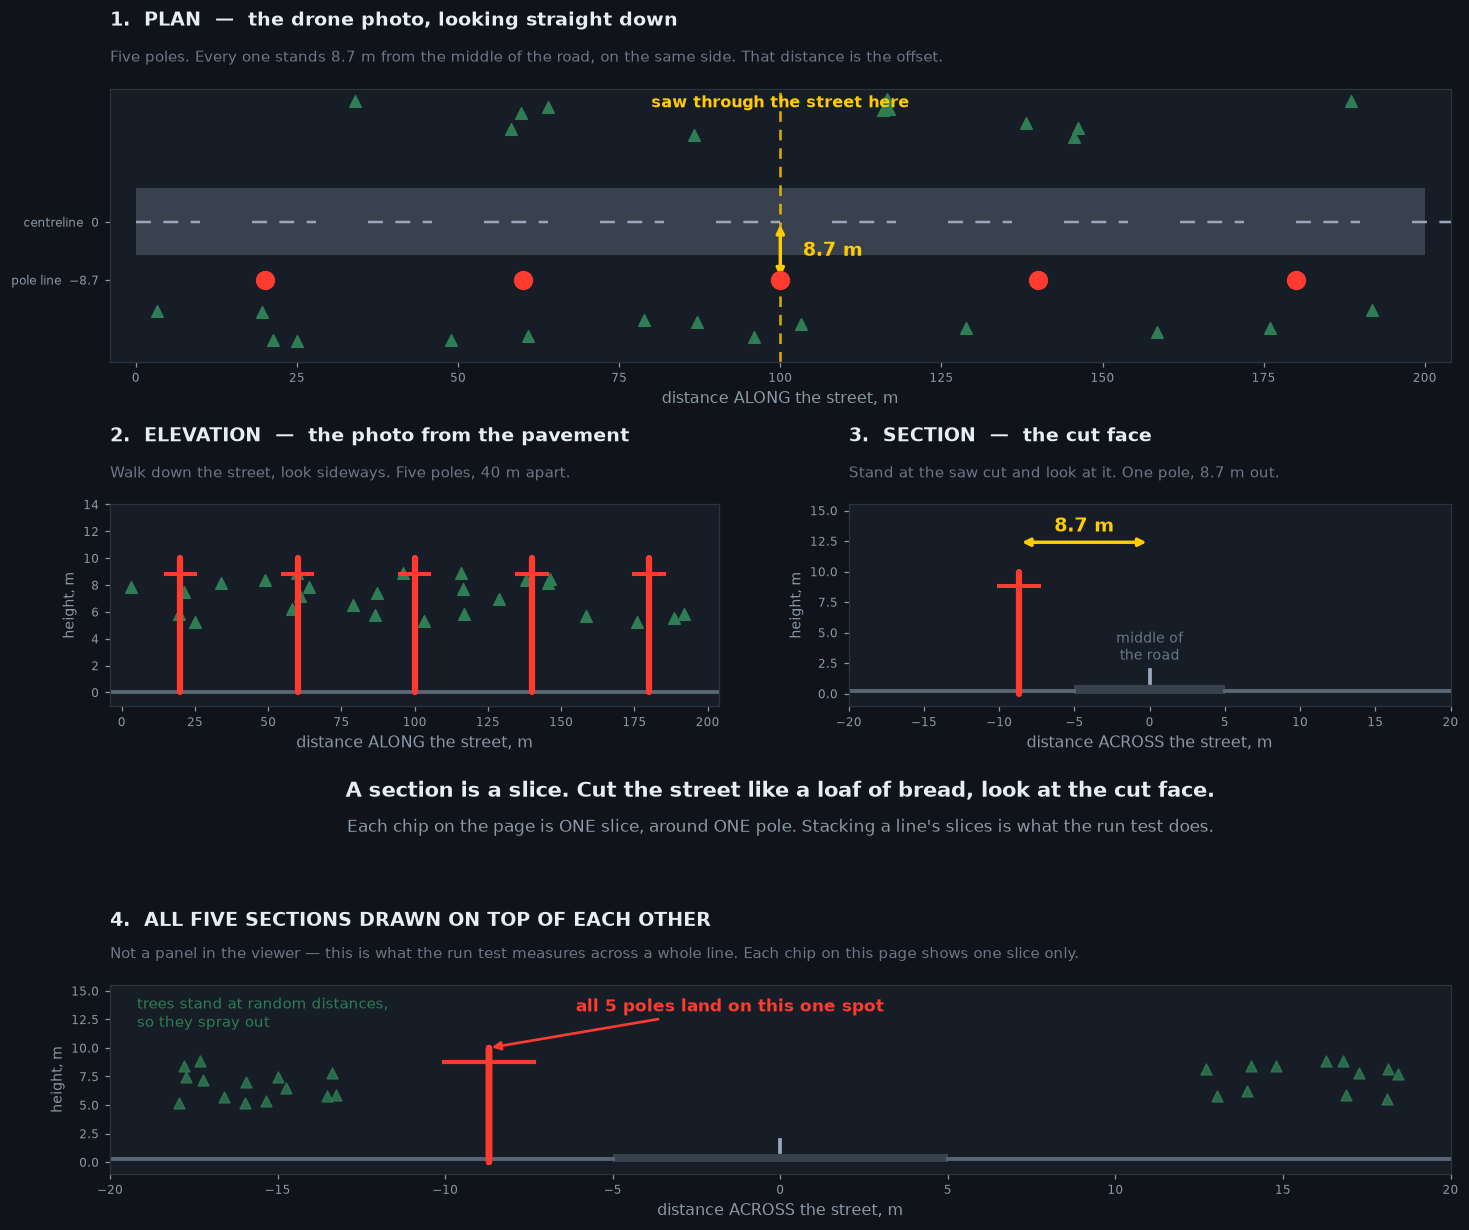
Four-panel figure: plan view of a street with five poles at a constant offset, the elevation view, one section at a saw cut, and all five sections drawn on top of each other
A section is a slice. Cut the street across like a loaf of bread and look at the cut face. Note panel 4: each chip below shows one slice around one pole, not the stack. Stacking a line's slices is what the run test does with the numbers.
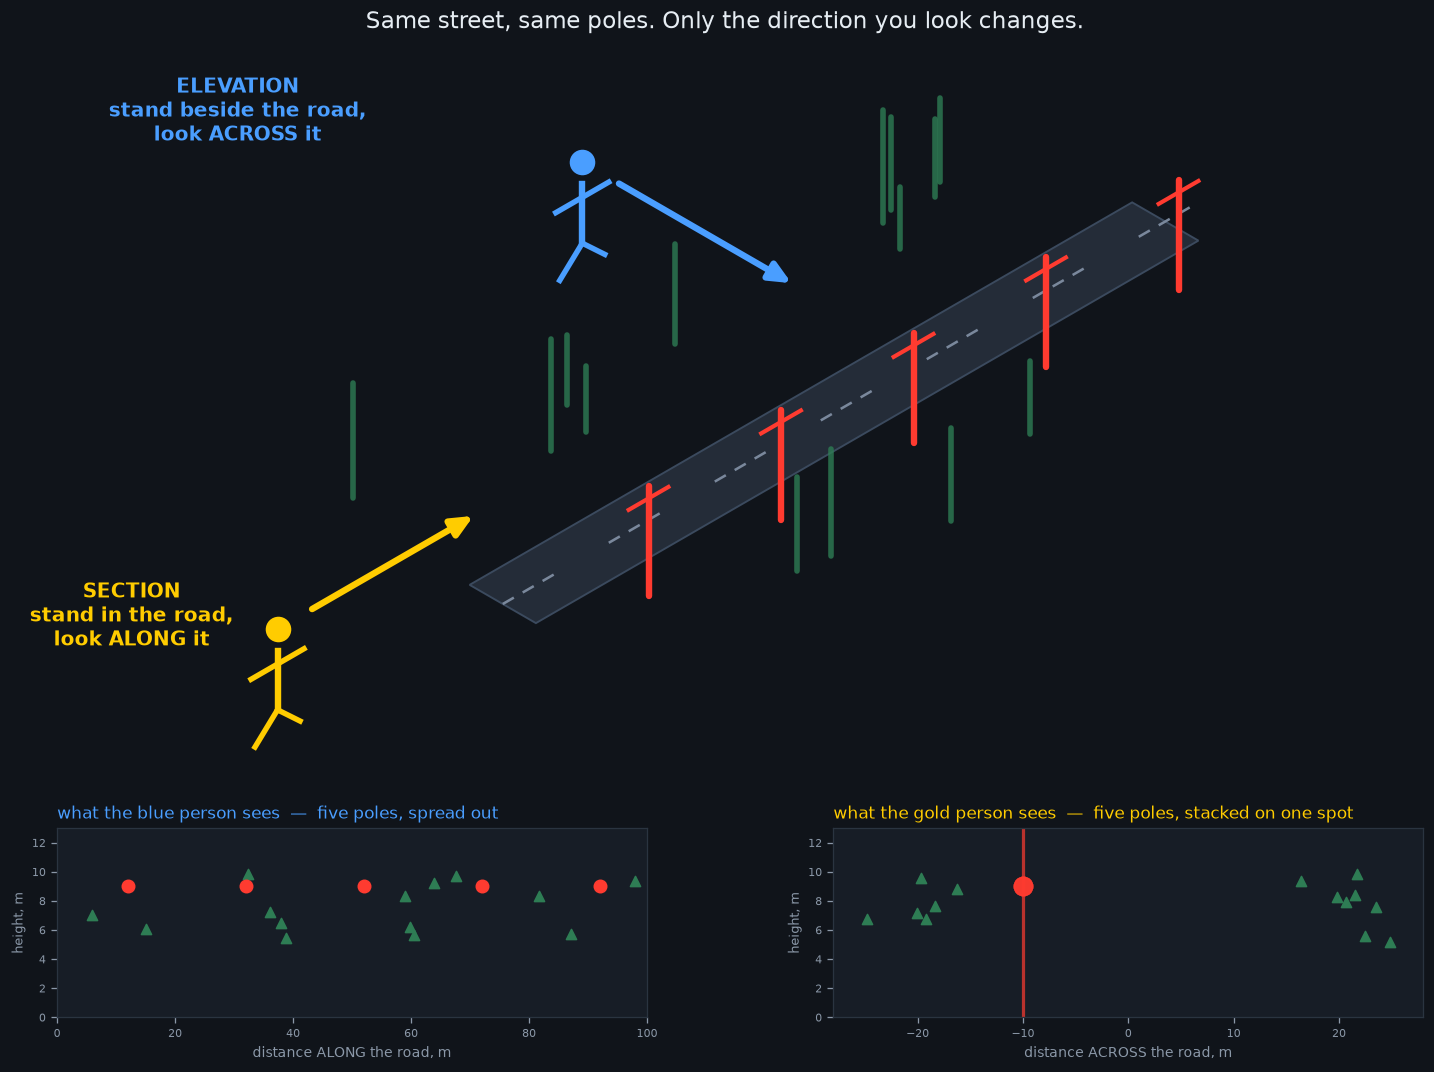
Isometric drawing of a road with poles, showing where an observer stands for the elevation view and for the section view
The same thing again, as a drawing in perspective. Where each view is taken from. The pole line is red, trees are green.
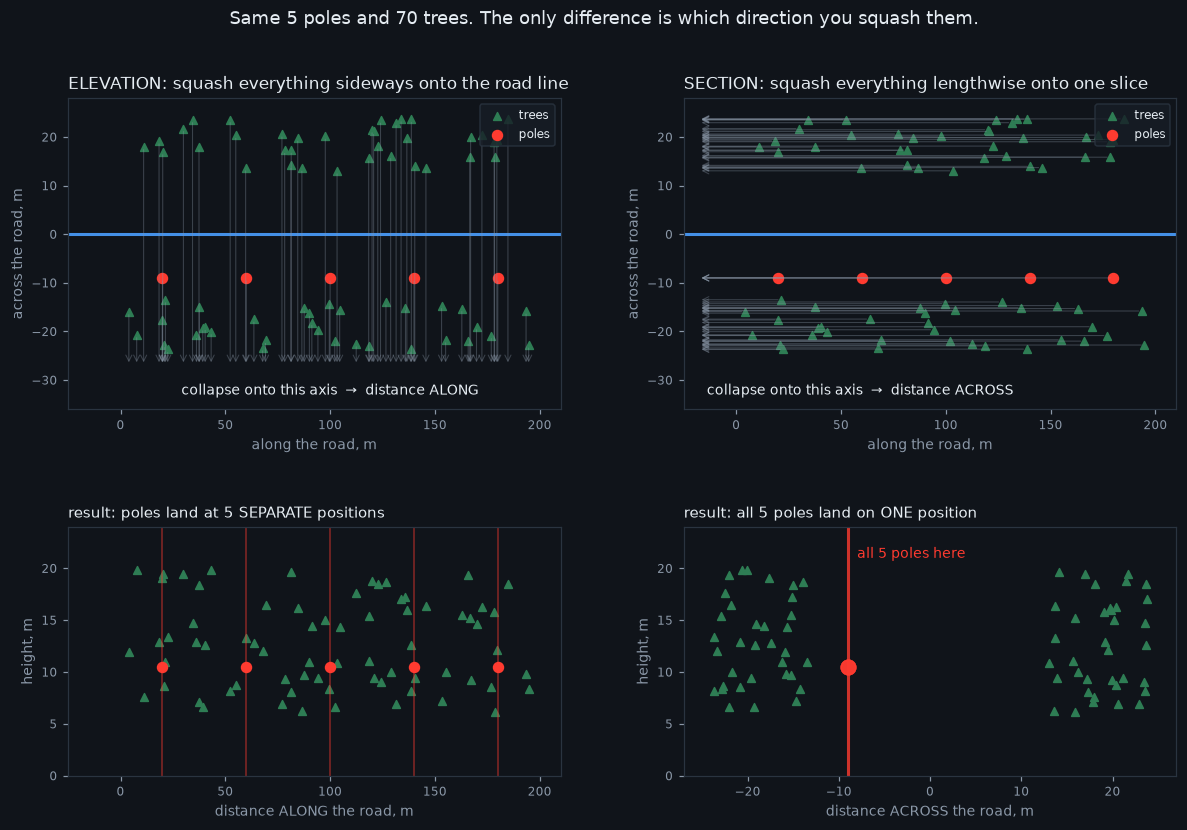
Four plots showing the same five poles and seventy trees collapsed onto the along-road axis and onto the across-road axis
The same projection drawn as plots. Grey arrows are the direction the points are squashed; the bottom row is the result.

Elevation keeps along the road, so you look across it: the poles stay spread out down the street, exactly as you would see them walking past. Section keeps across the road and throws the along-axis away, so every slice of the street is stacked on top of the next one. Poles that are 40 m apart but at the same setback land on the same spot. That stacking is the point: the run test only cares about the setback, so on a real utility line the red marker should sit at the same offset in every pole's section panel.

If the section looks from the side, why is the red line vertical? Because the red line is not an object in the scene, it is a ruler mark. It is drawn at one x-position and stretched over the full height simply so you can see it, exactly like the x gridline it replaces. In the elevation panel it marks along = 0; in the section panel it marks the pole's signed offset. Nothing vertical is being depicted — the question it answers is does the cluster of returns sit on this mark or beside it?

imagerySatellite scene, same centre and same scale as the plan panel. Context only, nothing is measured from it.
planLooking straight down, and the only panel showing the full horizontal scatter. A pole is a knot one to two metres across; a tree crown is a broad blob. Blue is the road centreline.
elevationHeight against distance along the road. Colour is offset, so a white column on the red line is the pole and red points are whatever stands across the road at the same point down the street.
sectionHeight against distance across the road. The x-position is the setback, the one number the run test uses. Two shaded windows cross here — the height band and the offset window — and a pole has to sit where they overlap. The blue line is the middle of the road, with the pole's distance from it marked: the window is centred on the pole, not on the street, so the centreline sits well off to one side.

Why does the section look so much like the elevation? Because a pole is vertical, and a vertical object projects to a vertical stripe from every horizontal direction. The two panels are supposed to show the same stripe. If they didn't, the thing would be leaning, and it would not be a pole.

What changes between them is where the stripe sits and what surrounds it. In elevation the pole is at x = 0 in every single chip, because the window is centred on it by construction, so that coordinate carries no information. In section it sits at its true signed offset (−8.7 m, say), and that number is comparable from pole to pole. Across a whole line the 39 confirmed lines hold their offset to a median spread of 1.3 m; a false line scatters. The surroundings move too: a treeline 10 m down the street is a hump in elevation and a wall standing off to one side in section.

The stacking in the drawing above happens along a whole line, not inside one chip. Each chip is a 32 m box and neighbouring poles are a median 37 m apart, so 80% of the time there is exactly one pole in the window and nothing to stack onto it yet.

scroll to zoom · drag to pan · double-click to reset